DNS/TCP Monitoring in QubesOS
.7.5. ………its-always-dns…….)……… …..^..f. // DNS
Detection is gaining more and more (management) attention. Corporations are aware that hardening is not enough and monitoring/logging is crucial to detect the intruder or at least identify activities after an incident has occurred.
In my opinion this does not only apply to our clients but also to our own operational and local infrastructure.
This article is just one example how to create a local logging infrastructure in QubesOS. So let’s start this series with the first milestone traffic collection to detect odd behaviors.
Sources and impact
Before diving into the how it makes sense to categorize and name additional event sources first. This figure is just a rough overview and by no means holistic, but can be used as a starting point:
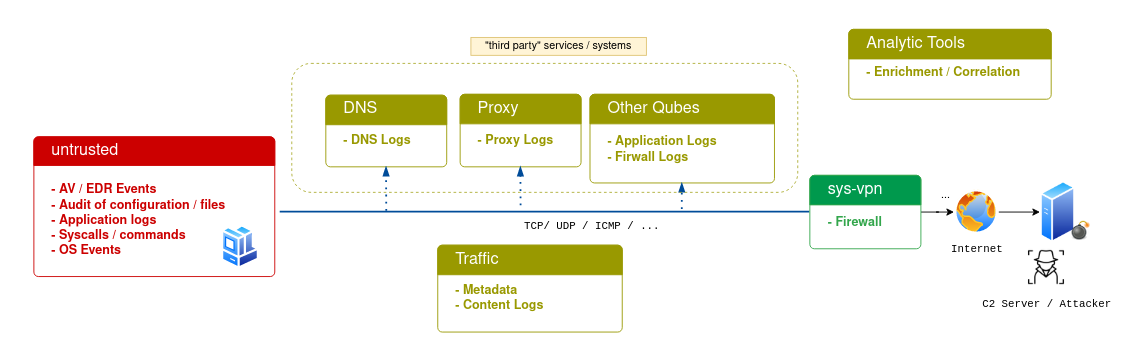
Endpoint logging sources (within the Qube):
- Syscalls, executed commands
- OS Logs
- Audit of specific folders/files/configurations
- Application specific Logs
- Agents / Engines
Traffic Logging Sources:
- Metadata
- Full Package capture
External Logs (Destination of a connection):
- DNS Server
- Proxys
- Application server
Analytic Tools:
- Can enrich the data (e.g. IP to country)
- Correlate or filter data
- Can create context or timelines
Why starting with network traffic first ?
For larger corporation the priority list from Florian Roth can be used for reference. However, starting with Traffic analysis in Qubes OS have some benefits:
- Through the separation of applications into different qubes / trusts the network traffic should look very homogenous.
- Traffic Analysis is transparent to the qube, so no configuration within the qube is neccessary. Furthermore traffic monitoring cannot easily be idenitfied from within the qube.
- Every Implant need to establish a C2 channel to receive further commands. The area of detection is therefore more focusing on C2 communication and lateral movement attempts.
Battleground & Roadmap
The only advantage that you have is: You can craft and modify the battleground in your favor. So let’s take a look what will be covered in this article:
| Mission | Logging source | Difficulty | Description | |
|---|---|---|---|---|
| I. Collect Network Metadata | Traffic | easy | Metadata analyze of network traffic | |
| I. Collect Full Packet capture | Traffic | easy | For later usage | |
| II. Collect DNS Request | DNSServer | easy | Identify which lookups are performed | |
| II. Configure DNS | DNSServer | easy | Controllable DNS to block/whitelist for each qube |
Current Setup
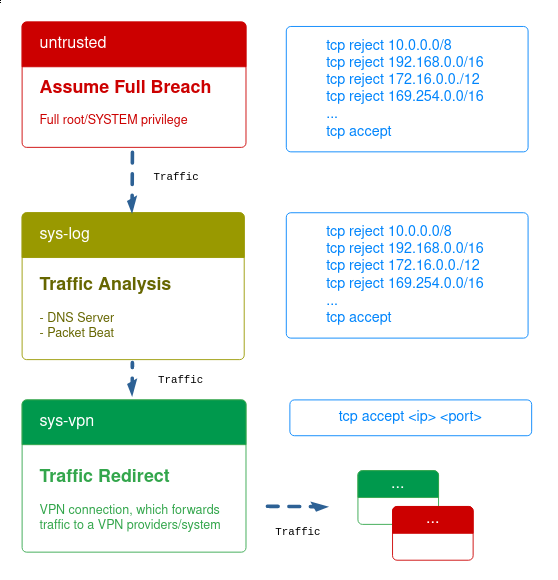
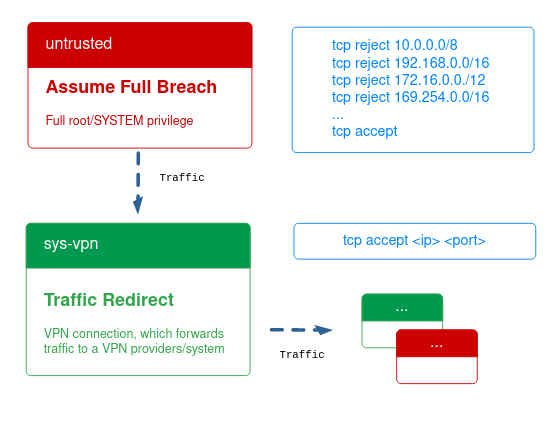
Let’s assume a full compromise of a working qube. Traffic is forwarded to a network vm, which tunnels everything.
Both qubes are restricted via qvm-firewall as can be seen in the figure.
Now let’s modify and implement the loggers.
Based on my personal Threat model a new Proxy VM is created, which is chained between the VPN qube and the untrusted qube and provides a DNS server and TCP logger via packetbeat.
I: Collect Network (Meta)data
The collection of metadata can be applied to all qubes and trust levels. This includes collection of source and destination, amount and size of the communication, protocol and port as well as the timestamp information.
For TCP traffic packetbeat from elastic is used.
Create the Logger AppVM
# dom0 - create sys-log appvm
qvm-create --template "fedora-32" --label "yellow" \
	--property vcpus=1 \
	--property maxmem=2048 \
	--property memory=1024 \
	--property provides_network=True \
	--property netvm=sys-vpn \
	sys-log

# dom0 - change network interface of untrusted
qvm-prefx -s untrusted netvm sys-log

# dom0 - firewall
qvm-firewall sys-log reset
qvm-firewall sys-log del --rule-no 0 # delete accept rule if not available
qvm-firewall sys-log add accept specialtarget=dns
qvm-firewall sys-log add drop 10.0.0.0/8
qvm-firewall sys-log add drop 172.16.0.0/12
qvm-firewall sys-log add drop 192.168.0.0/16
qvm-firewall sys-log add drop 169.254.0.0/16
qvm-firewall sys-log add accept
Configuration of Packetbeat
Most of the packetbeat configuration is default. The main purpose of packetbeat for this scenario is meta information.
Full packet capture is done via a different tool. Therefore, period is set to -1s and several fields are dropped to reduce the volume.
The most important parts of the packetbeat.yml can be found here
For automatic logging on startup it is possible to create .desktop files placed in the $HOME/.config/autostart/ directory. The following configuration might be used
# mkdir -p ~/.config/autostart
# copied from /usr/share/applications/xterm.desktop
[Desktop Entry]
Name=Logger
GenericName=Start Logger
Comment=Starting Logging Services on startup
Exec=sh -c "sudo $HOME/packet-beat -c $HOME/packet-beat.yml"
Terminal=false
Type=Application
Encoding=UTF-8
Icon=xterm-color
Categories=System;TerminalEmulator;
Keywords=shell;prompt;command;commandline;cmd;
X-Desktop-File-Install-Version=0.24
Configuration for full package capture
Several options are available for full package capture:
- https://github.com/arkime/arkime
- packetbeat with the
packetbeat -e -dump trace.pcapoption - Simple capture via
tcpdump -i <interface> -w fulldump.pcap - Simple capture with gopacket or a modified version
II. Collect and Configure DNSdata
Based on my personal threat model the DNS server is also installed on the same machine. Since golang is my personal choice blockly will be used as a DNS server. But there are plenty of articles how to setup pi-hole in qubes if this fits you more:
- https://www.reddit.com/r/Qubes/comments/i6gbvy/heres_a_quick_hacked_together_pihole_installation/
- https://blog.tufarolo.eu/how-to-configure-pihole-in-qubesos-proxyvm/
Before blockly can be used, some firewall adjustments needed to be mad, which should be appended to the /rw/config/qubes-firewall-user-script script of the sys-log qube:
# Content of /rw/config/qubes-firewall-user-script

# Local DNS
## Accept requests to port 5353
iptables -N DNS-SINK
iptables -A DNS-SINK -p udp -m udp --dport 5353 -m conntrack --ctstate NEW -j ACCEPT
iptables -A DNS-SINK -p tcp -m tcp --dport 5353 -m conntrack --ctstate NEW -j ACCEPT
iptables -I INPUT -j DNS-SINK
iptables -I FORWARD -d 169.254.169.254/32 -j DROP

# Redirect Magic DNS Ips to DNS server to port 5353
iptables -F PR-QBS
iptables -A PR-QBS -t nat -d 10.139.1.1/32 -p udp --dport 53 -j DNAT --to <ip-of-sys-log>:5353
iptables -A PR-QBS -t nat -d 10.139.1.1/32 -p tcp --dport 53 -j DNAT --to <ip-of-sys-log>:5353
iptables -A PR-QBS -t nat -d 10.139.1.2/32 -p udp --dport 53 -j DNAT --to <ip-of-sys-log>:5353
iptables -A PR-QBS -t nat -d 10.139.1.2/32 -p tcp --dport 53 -j DNAT --to <ip-of-sys-log>:5353
Configuration of the logger
Blockly (and pi-hole) can be configured to use the qubes names. For blockly the following command can be used to create the clients field in the configuration:
# dom0
qvm-ls --fields NAME,IP --raw-data | tr -s ' ' ':' | grep -v ':-' \
	| sed 's|\(.*\):\(.*\)|         \1: [\2]|g' \
	| qvm-run --pass-io sys-log 'cat - > $HOME/client_list'
Afterwards it is possible to specify the white/blocklist for each qube or prefix of qubes.
These can also be created later - after visualization and searching through the typical domains.
As documented in the iptables changes blockly can be started on port 5353 to prevent executing it with root privileges.
For automatic logging on startup it is possible to create .desktop files placed in the $HOME/.config/autostart/ directory. The following configuration might be used
# mkdir -p ~/.config/autostart
# copied from /usr/share/applications/xterm.desktop
[Desktop Entry]
Name=DNS
GenericName=Start DNS
Comment=Starting DNS Services on startup
Exec=sh -c "sudo $HOME/blockly -c $HOME/blockly.yml"
Terminal=false
Type=Application
Encoding=UTF-8
Icon=xterm-color
Categories=System;TerminalEmulator;
Keywords=shell;prompt;command;commandline;cmd;
X-Desktop-File-Install-Version=0.24
Test everything
Create a DVM, which is chained to sys-log and issue a DNS request. You should see a TSV file from blockly.
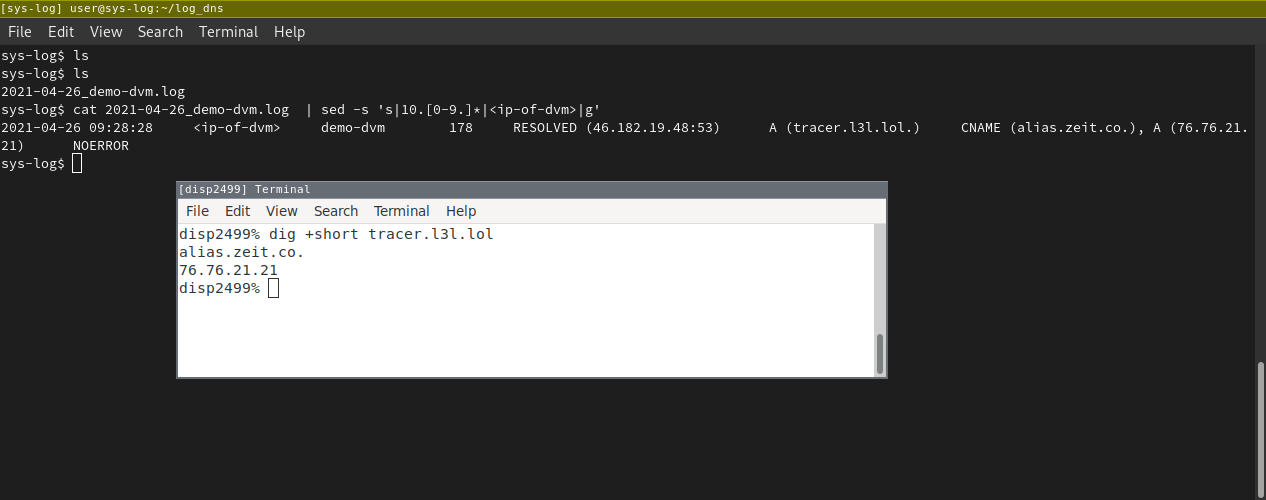
And it also seems that the HTTP request is also logged via packetbeat. Great now we have the data

Summary
The first milestone is done and it’s now possible to collect traffic metadata and DNS. Furthermore, individual DNS settings can be changed and white/ blocklist can be applied to each individual qube.
The collected data is the foundation for basic and sophisticated analysis, which will be described in the follow-up article.
So far we modified our setup with sys-log running packetbeat and a DNS server.